How to Write Piecewise Functions – A piecewise function is a mathematical function that consists of a set of pieces, where the function only takes a specific form in a subset of input values. It can have multiple variables. Piecewise functions are used in different branches of mathematics, especially where several variables must be involved to model a specific situation. In this tutorial, we will introduce how to write these functions as well as methods for using graphically and numerically.
Table of Contents
What is a piecewise function?
To fully understand what piecewise functions are and how we can construct our own piecewise-defined functions, let’s first dive into a deeper understanding of how it works.
Piecewise function definition
A piecewise function is a function that is defined by different formulas or functions for each given interval. It’s also in the name: piece. The function is defined by pieces of functions for each part of the domain.
2x, for x > 0
1, for x = 0
-2x, for x < 0
As can be seen from the example shown above, f(x) is a piecewise function because it is defined uniquely for the three intervals: x > 0, x = 0, and x < 0.
How to read piecewise functions?
Once we have a given piecewise-defined function, we can interpret it by looking at the given intervals. If we take a look at our example, we can read it as:
- When x > 0, f(x) is equal to 2x.
- When x = 0, f(x) is equal to 1.
- When x < 0, f(x) is equal to -2x.
When given a piecewise function graph, make sure to observe the given intervals where f(x) has varied graphs. But before we try out examples that involve analyzing piecewise function graphs, let’s go ahead and learn how we can evaluate and graph piecewise functions first.
How to solve piecewise functions?
Now that we’ve learned about this unique function, how do we make sure that we return the right value for the function given x? Here are tips to remember when solving for and evaluating piecewise functions:
- Double-check where x lies in the given interval.
- Evaluate the value using the corresponding function.
Let’s say we want to find f(8) using the piecewise function that we’ve shown.
2x, for x > 0
1, for x = 0
-2x, for x < 0
Since 8 is greater than 0, the function we’ll use to evaluate f(8) is f(x) = 2x. Hence, we have f(8) = 2(8) = 16. This also means that f(-6) = -2(-6) = 12 and f(0) = 1.
How to Graph a Piecewise Function
Steps
- Get your piecewise function. When you look at a piecewise function, you will see the common functional notation. The body of the function is actually an array of functions and associated subdomains.
- As an example, let’s take the following function, with its list of sub-functions listed for particular intervals of x:
- F(x) = x + 1 where x is greater to or equal to -1; and x – 1 where x is less that -1
- Note that this piecewise function has two sub-functions: f(x) = x + 1 and f(x) = x-1. Each of these sub-functions are valid on different parts of the number line, where x≥-1 and x<-1, respectively.
- Draw two lines in a + shape on your paper. The horizontal line is your x axis; the vertical line is your y axis.
- Mark both lines with equally spaced numbers. For the x axis, numbers are positive on the right side and negative on the left side; for the y axis numbers are positive above the x axis and negative below it.
- Calculate f(x) for every x. Once you’ve got your axes set up, take your piecewise function and begin calculating values of f(x). To do this, replace the x in the function f(x) with its value. For example: f(x) = x + 1 at x = -1 is replaced with f(-1) = -1 + 1 = 0.
- Remember that in piecewise functions, your calculation will change depending on the value of x. In this example, recall that if x is greater than or equal to -1, then you should use the equation f(x) = x + 1. If x is less than -1, though, you should use the equation f(x) = x – 1.
- Draw the graph points for each pair. Once you have calculated these values, you can draw a graph point for each pair. Sketch imaginary lines (red lines) vertically on the x axis and horizontally on the y axis for each pair. Graph points will be where these lines intersect.
- Be careful to ensure the validity of the sub-functions on the x axis.
- Draw all the graph points on the plane. You will now have a number of graph points represented on your x-y plane. Remove all your imaginary lines to reveal all of your points.
- Join all the graph points. To complete your graph, join these graph points smoothly in continuous lines.
- Note that because this is a piecewise function with two sub-functions, your graph will have two separate lines, which do not meet.
Tips
- When you graph piecewise functions, remember to use the sub-functions only on their assigned intervals. Choose the length of your x axis accordingly.
- You can choose any spacing between the numbers on your x and y axes. Be aware, though, that the closer the points are (in other words, the smaller the spacing), the more accurate your graph will be.
Example 1
Evaluate the given piecewise function at the given values of x as shown below.
√x , for x > 0
5, for x = 0
x/6, for x < 0
a. f(-36)
b. f(0)
c. f(49)
Solution
- When x = -36 (or less than 0), the expression for f(x) is x/6. Let’s evaluate f(-36) using the expression. Hence, we have f(-36) = -36/6 = -6.
- When x = 0, f(x) is a constant. This means that we have f(0) = 5.
- When x = 49 (and consequently, greater 0), the expression for f(x) is √x. Let’s evaluate f(49) using the expression. Hence, we have f(49) = √49 = 7.
Example 2
Graph the piecewise function shown below. Using the graph, determine its domain and range.
2x , for x ≠ 0
1, for x = 0
Solution
For all intervals of x other than when it is equal to 0, f(x) = 2x (which is a linear function). To graph the linear function, we can use two points to connect the line. Just make sure that the two points satisfy y = 2x. Make sure to leave the point of origin unfilled.
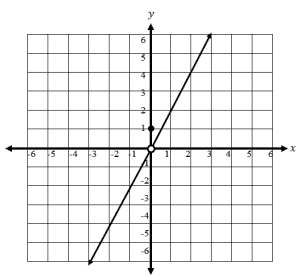
Since f(x) = 1 when x = 0, we plot a filled point at (0,1). The graph above shows the final graph of the piecewise function.
Since the graph covers all values of x, the domain would be all real numbers or (-∞, ∞). The same reasoning applies to the range of functions. Since it extends in both directions, the range of the function is (-∞, ∞) in interval notation.
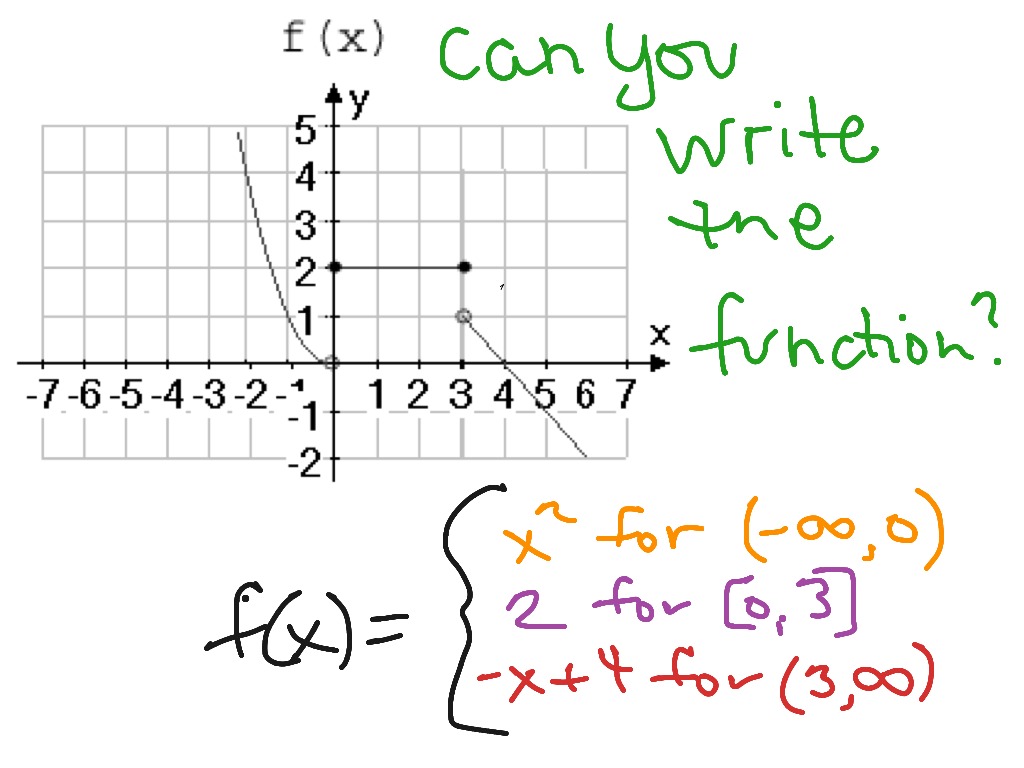
Example 3
Graph the piecewise function shown below. Using the graph, determine its domain and range.
x2 , for x ≤ 0
5, for 0 < x < 2
x/2 , for x ≥ 2
Solution
Let’s first break down the three intervals and identify how the graph of function would look like:
- When x ≤ 0, f(x) becomes a quadratic function with a parabola that passes through the origin and (-2, 4). Since it only applies for 0 and negative numbers, we will only half of the parabola.
- When 0 < x < 2, f(x) will a represent a constant which is a horizontal line passing through y = 5. Make sure to leave (0,5) and (2,5) unfilled since they are not part of the solution.
- When x ≥ 2, f(x) is a function and will pass through (2, 1) and (6,3).
Using this information, we can now graph f(x).
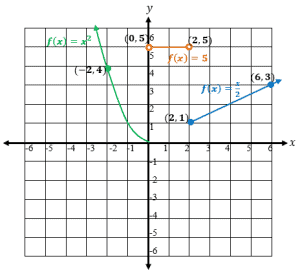
The image above breaks down the three components of the piecewise function. Let’s go ahead and simplify this graph now so that we can analyze it for its domain and range.
Since all values of x extend in both directions, the domain would be all real numbers or (-∞, ∞). Since the graph only covers the values of y above the x-axis, the range of the function is [0, ∞) in interval notation.
Example 4
Spoken word poetry is being held at the nearby cafe. They charge 6perpersonforatableof1to5guests.Theyalsoofferafixedfeeof50 for a table with 6 or more people. Write a function that relates the number of people,x, and the cost of attending the event, f(x).
Solution
Let’s go ahead and break down the problem and find the expression of f(x) for each interval:
- For a table of 1 to 5 guests, we can express that as 1 ≤ x ≤ 5 in terms of x. Since it would cost each guest $6, the total for x guests is 6x.
- Now, for a table with 6 or more people, we can express the interval as x ≥ 6. For this interval, f(x) will always be equal to 60.
We can now summarize this into a piecewise function:
6x, for 1 ≤ x ≤ 5
50, for x ≥ 6
This piecewise function represents the cost of f(x) for x number of guests.
Conclusion
Piecewise functions are functions that consist of two parts. These two parts are known as pieces. Each part is defined by a vertical line called a break point . The break point marks the place where the first part of the function ends and the second part of the function starts. The first part of a piecewise function is called the domain and the second part is called codomain or range.”