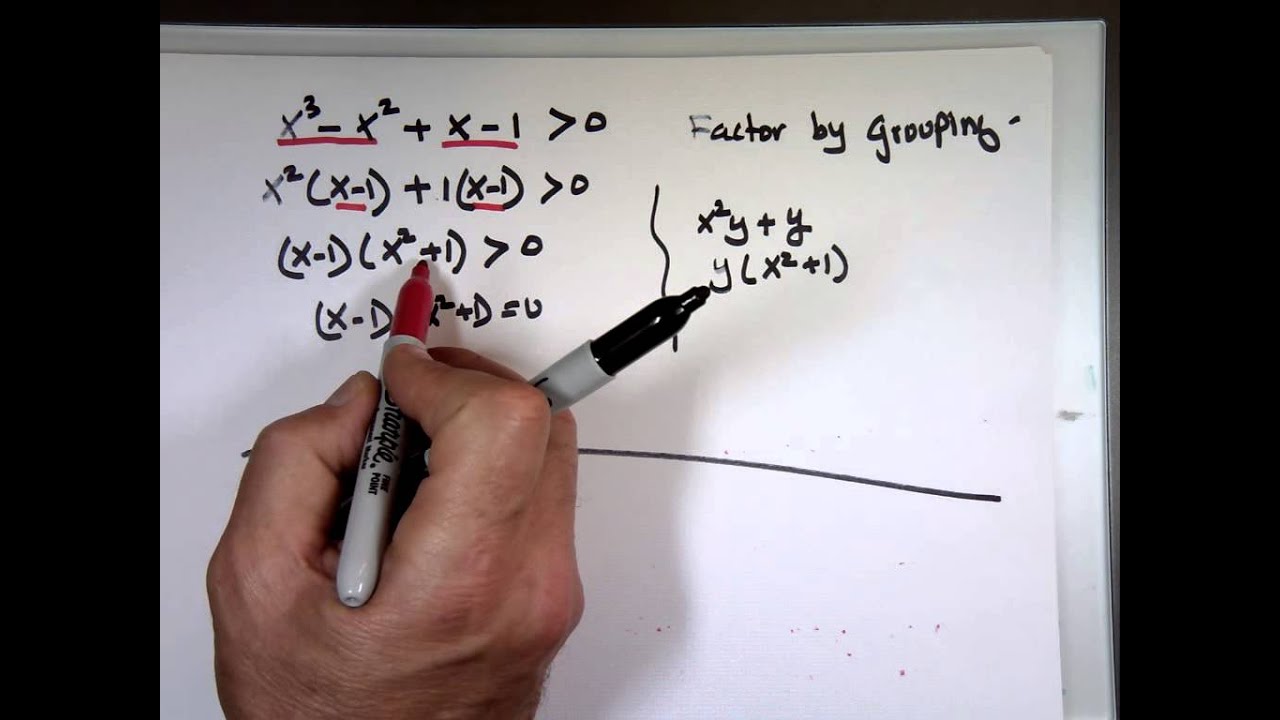
How to Solve Nonlinear Inequalities – A system of nonlinear equations is a system of two or more equations in two or more variables containing at least one equation that is not linear. Recall that a linear equation can take the form Ax+By+C=0. Any equation that cannot be written in this form in nonlinear. The substitution method we used for linear systems is the same method we will use for nonlinear systems. We solve one equation for one variable and then substitute the result into the second equation to solve for another variable, and so on. There is, however, a variation in the possible outcomes.
The average cost of a dozen eggs from a small farm can be modeled by C(x)=0.364x+5790x
, where x is the number of eggs produced in dozens. The farmer would like to keep the costs less than $0.75 per dozen eggs. How many eggs would his chickens have to produce?
This function is not linear and the solution will be an interval of answers since there is a range for the desired costs. The words “less than” indicate an inequality. Thus the function is an example of a nonlinear inequality.
Table of Contents
Nonlinear Inequality
A nonlinear inequality is a mathematical statement containing an inequality such as < or > and the expression does not describe a striaght line.
Finding Critical Numbers
The first step to solve a nonlinear inequality is to find the critical numbers. These are input values that make the expression equal zero or be undefined.
To find critical numbers
- Make one side of the inequality equal zero.
- Replace the inequality with an equal sign and solve for x.
- Find any x-values that cause the expression to be undefined, such as dividing by zero or square roots of negative numbers.
Example 1: Finding Critical Numbers
The average cost of a dozen eggs from a small farm can be modeled by C(x)=0.364x+5790x
, where x is the number of eggs produced in dozens. The farmer would like to keep the costs less than $0.75 per dozen eggs. How many eggs would his chickens have to produce?
Solution
Write the inequality based on the problem. The costs are to be less than $0.75, so the 0.75 is the biggest the costs can be. So, the big side of the inequality will face the 0.75.0.75>0.364x+5790x
Make one side zero and simplify.0>0.364x+5790x−0.750>0.364x+5790x−0.75xx0>−0.386x+5790x
Replace the inequality with an equal sign and solve for x.0=−0.386x+5790x
0 = -0.386x + 5790
−5790 = −0.386x
x = 15,000
Find any x-values that cause the expression to be undefined.0>−0.386x+5790x
The function will be undefined if the denominator is equal to zero. So, x = 0 is a critical number.
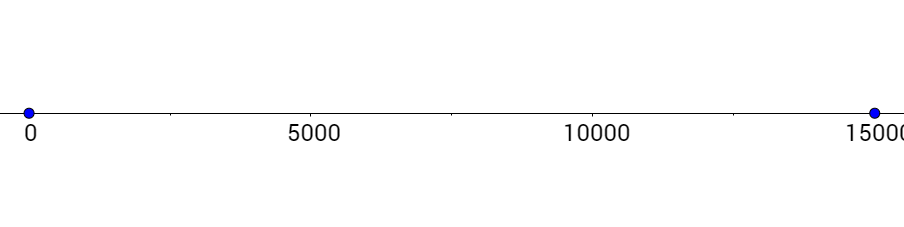
The critical numbers are 0 and 15,000.
Try It 1
Find the critical numbers of 0 < 2x2 − 9x − 5.
Answer
−1⁄2, 5
Solve Nonlinear Inequalities Algebraically
Now that we have found the critical numbers, we can finish solving for x. The critical numbers are places where the function can change from the positive numbers to negative. In other words, the critical numbers show where the function changes between greater than zero and less than zero. If we test the intervals between the critical numbers we can see which are greater than zero and which are less than zero.
Solving Nonlinear Inequalities Algebraically
- Find the critical numbers.
- Graph the critical numbers on a number line.
- Choose a number to test in each interval between the critical numbers.
- Test these numbers in the inequality to see which produce true statements.
- The intervals that produce true statements are the solutions.
Example 2: Solving a Nonlinear Inequality
The average cost of a dozen eggs from a small farm can be modeled by C(x)=0.364x+5790x
, where x is the number of eggs produced in dozens. The farmer would like to keep the costs less than $0.75 per dozen eggs. How many eggs would his chickens have to produce?
Solution
We have already rewritten this in example 1 as0>−0.386x+5790x
and we found that the critical numbers are 0 and 15,000.
Plot those critical numbers on a number line.
Choose a number in each interval between the critical numbers. −100, 5000, and 15100 will work.
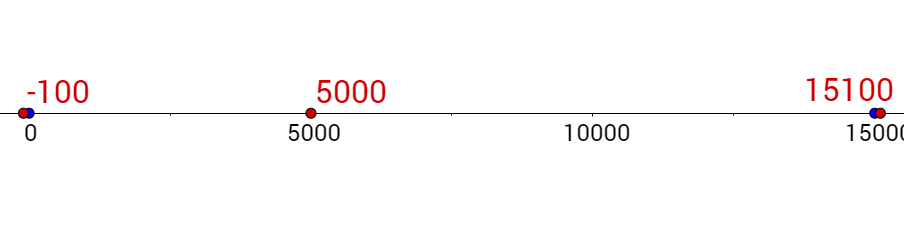
Test these in the inequality to see which produce true statements.−100:0>−0.386(−100)+5790−100→0>−58.286 True5000:>−0.386(5000)+57905000→0>0.772 False15100:>−0.386(15100)+579015100→0>−0.00256 True
The solutions are the true intervals: (−∞, 0) and (15,000, ∞). Since the hens cannot produce a negative number of eggs, the farm needs to produce more than 15,000 dozen eggs.
Analysis
Both ends of the intervals are parentheses because the inequality is not an equals inequality. If the inequality was ≤ or ≥, there would be a bracket at the end of the interval. However, critical numbers that cause the expression to be undefined always are given a parenthesis in interval notation because x cannot be those numbers.
Example 3: Solving a Nonlinear Inequality Algebraically
Solve −2≤2x2−12x
.
Solution
Solve one side for zero.0≤2x2−12x+20≤2x2−12x+2xx0≤2x2+2x−12x
Find the critical numbers.0=2x2+2x−12x
0 = 2x2 + 2x − 12
0 = 2(x2 + x − 6)
0 = 2(x + 3)(x − 2)
x = −3, 2
0 is also a critical number because the inequality is undefined when x = 0.
Graph the critical numbers on a number line and pick test numbers in each interval. −4, −1, 1 and 3 will work for test numbers.
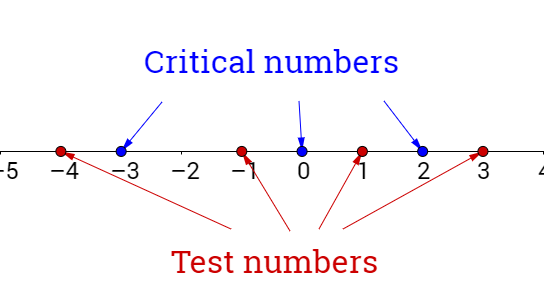
Test the test numbers in the solved inequality.−4:0≤2(−4)2+2(−4)−12(−4)→0≤−3 False−1:0≤2(−1)2+2(−1)−12(−1)→0≤12 True1:0≤2(1)2+2(1)−12(1)→0≤−8 False3:0≤2(3)2+2(3)−12(3)→0≤4 True
The solutions are [−3, 0) and [2, ∞).
Analysis
The critical number 0 comes from when the inequality is undefined, so x ≠ 0. That is why the 0 has a parenthesis by it. The −3 and 2 have brackets by them because x can equal them from the ≤ sign.
Try It 2
Solve 0 < 2x2 − 9x − 5.
Answer
(−1⁄2, 5)
Solve Nonlinear Inequalities by Graphing
An alternate way to solve nonlinear inequalities is by graphing. Remember a coordinate plane is simply two number lines set perpendicularly. By solving the inequality so that one side is zero and graphing the expression, we can compare the function with zero. The critical numbers are the zeros and the undefined values. The zeros occur at the x-intercepts; the undefined values often occur at vertical asymptotes. These can both be read from the graph. Intervals on the graph where the y-values are positive are where the inequality is greater than zero. Negative y-values show the intervals where the inequality is less than zero.
Solve Nonlinear Inequalities by Graphing
- Solve the inequality so one side is zero.
- Graph the resulting expression from the nonzero side of the inequality.
- If the inequality is > 0, the solutions are intervals with positive y-values.
- If the inequality is < 0, the solutions are intervals with negative y-values.
Example 4: Solve Nonlinear Inequality by Graphing
Solve 8 ≥ x2 − 2x.
Solution
Solve the inequality so one side is zero.
8 ≥ x2 − 2x
0 ≥ x2 − 2x − 8
Graph the right-hand expression.
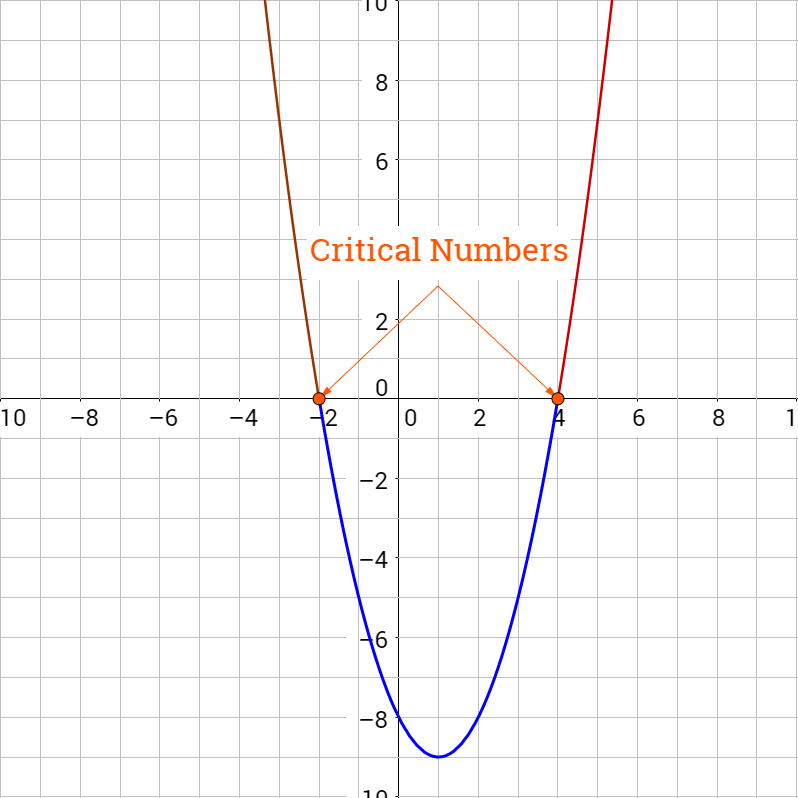
Since the expression is less than zero, the solutions are intervals with negative y-values. The solution is [−2, 4].
Example 5: Solve Nonlinear Inequality by Graphing
Solve 0<x−3x2+x−2
.
Solution
The inequality is already solved for zero, so we graph the right-hand expression.
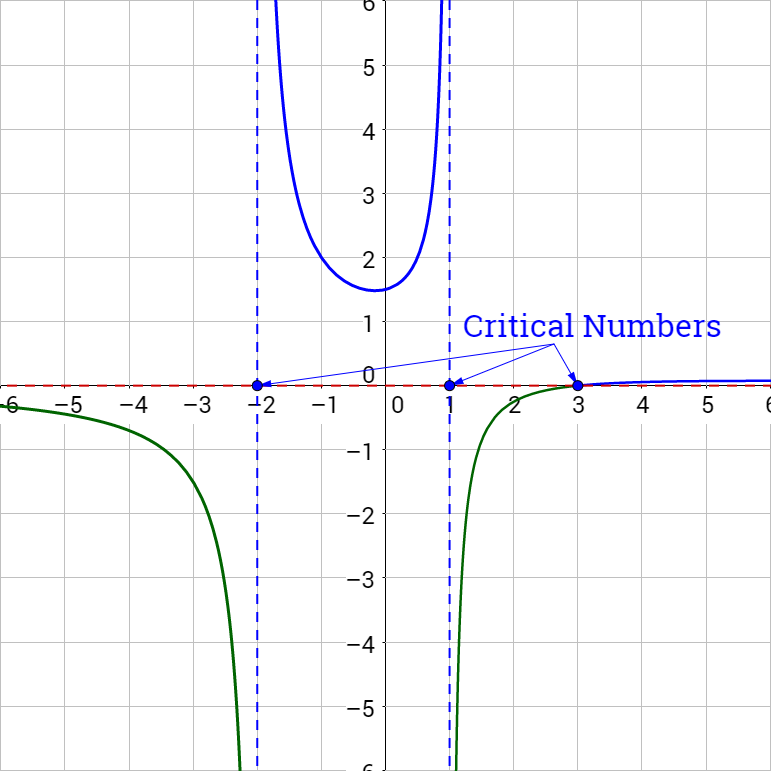
Since the expression is greater than zero, the solutions are intervals with positive y-values. The solutions are (−2, 1) ∪ (3, ∞).
Try It 3
Solve 0>x2x−2
by graphing.
Answer
(2, ∞)
Nonlinear Inequality
A nonlinear inequality is a mathematical statement containing an inequality such as < or > and the expression does not describe a striaght line.
To find critical numbers
- Make one side of the inequality equal zero.
- Replace the inequality with an equal sign and solve for x.
- Find any x-values that cause the expression to be undefined, such as dividing by zero or square roots of negative numbers.
Solving Nonlinear Inequalities Algebraically
- Find the critical numbers.
- Graph the critical numbers on a number line.
- Choose a number to test in each interval between the critical numbers.
- Test these numbers in the inequality to see which produce true statements.
- The intervals that produce true statements are the solutions.
Solve Nonlinear Inequalities by Graphing
- Solve the inequality so one side is zero.
- Graph the resulting expression from the nonzero side of the inequality.
- If the inequality is > 0, the solutions are intervals with positive y-values.
- If the inequality is < 0, the solutions are intervals with negative y-values.