How to Solve Standard Deviation – Standard deviation is the positive square root of the variance. Standard deviation is one of the basic methods of statistical analysis. Standard deviation is commonly abbreviated as SD and denoted by ‘σ’ and it tells about the value that how much it has deviated from the mean value. If we get a low standard deviation then it means that the values tend to be close to the mean whereas a high standard deviation tells us that the values are far from the mean value. Let us learn to calculate the standard deviation of grouped and ungrouped data and the standard deviation of a random variable.
Standard deviation is a useful measure of spread for normal distributions.
In normal distributions, data is symmetrically distributed with no skew. Most values cluster around a central region, with values tapering off as they go further away from the center. The standard deviation tells you how spread out from the center of the distribution your data is on average.
Many scientific variables follow normal distributions, including height, standardized test scores, or job satisfaction ratings. When you have the standard deviations of different samples, you can compare their distributions using statistical tests to make inferences about the larger populations they came from.

Table of Contents
The empirical rule
The standard deviation and the mean together can tell you where most of the values in your distribution lie if they follow a normal distribution.
The empirical rule, or the 68-95-99.7 rule, tells you where your values lie:
- Around 68% of scores are within 2 standard deviations of the mean,
- Around 95% of scores are within 4 standard deviations of the mean,
- Around 99.7% of scores are within 6 standard deviations of the mean.
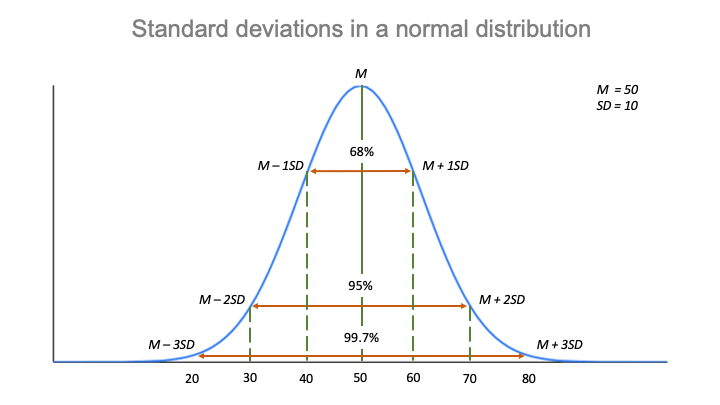
The empirical rule is a quick way to get an overview of your data and check for any outliers or extreme values that don’t follow this pattern.
For non-normal distributions, the standard deviation is a less reliable measure of variability and should be used in combination with other measures like the range or interquartile range.
Standard deviation formulas for populations and samples
Different formulas are used for calculating standard deviations depending on whether you have data from a whole population or a sample.
Population standard deviation
When you have collected data from every member of the population that you’re interested in, you can get an exact value for population standard deviation.
The population standard deviation formula looks like this:
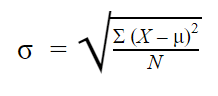
| σ = population standard deviation ∑ = sum of… X = each value μ = population mean N = number of values in the population |
Sample standard deviation
When you collect data from a sample, the sample standard deviation is used to make estimates or inferences about the population standard deviation.
The sample standard deviation formula looks like this:
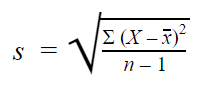
| s = sample standard deviation ∑ = sum of… X = each value x̅ = sample mean n = number of values in the sample |
With samples, we use n – 1 in the formula because using n would give us a biased estimate that consistently underestimates variability. The sample standard deviation would tend to be lower than the real standard deviation of the population.
Reducing the sample n to n – 1 makes the standard deviation artificially large, giving you a conservative estimate of variability.
While this is not an unbiased estimate, it is a less biased estimate of standard deviation: it is better to overestimate rather than underestimate variability in samples.
Receive feedback on language, structure and formatting
Professional editors proofread and edit your paper by focusing on:
- Academic style
- Vague sentences
- Grammar
- Style consistency
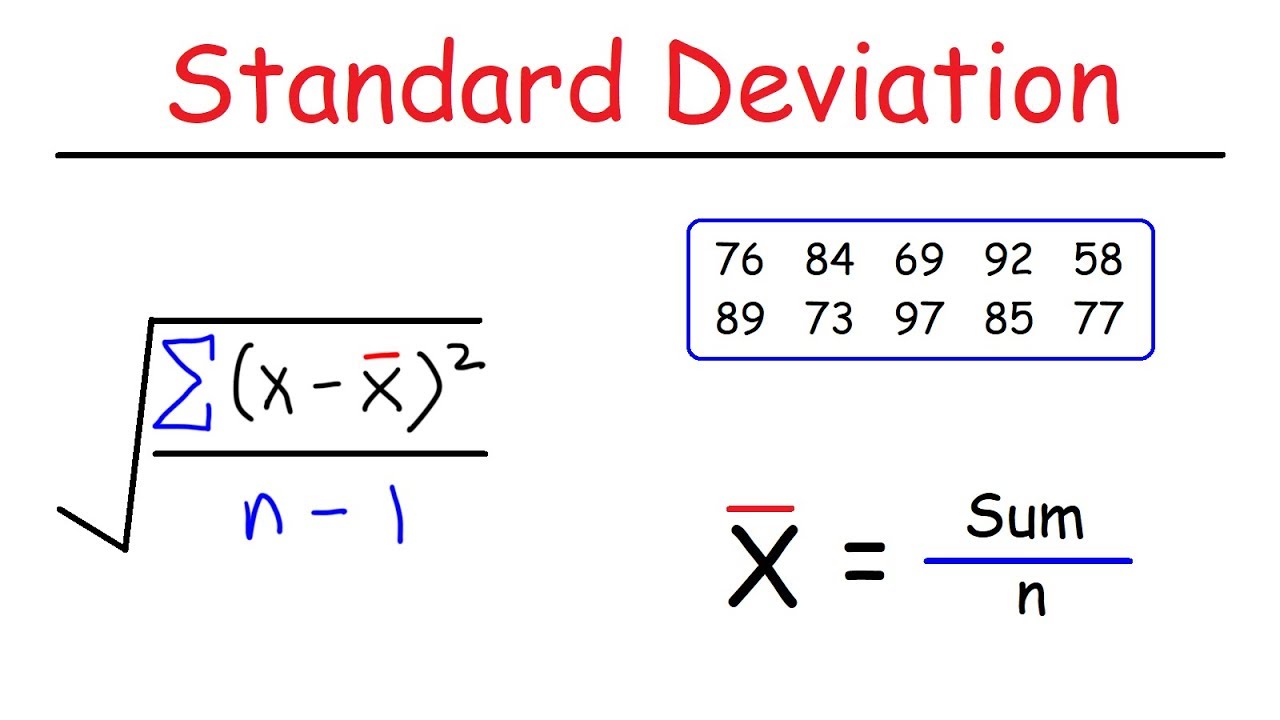
Steps for calculating the standard deviation
The standard deviation is usually calculated automatically by whichever software you use for your statistical analysis. But you can also calculate it by hand to better understand how the formula works.
There are six main steps for finding the standard deviation by hand. We’ll use a small data set of 6 scores to walk through the steps.
| 46 | 69 | 32 | 60 | 52 | 41 |
Step 1: Find the mean
To find the mean, add up all the scores, then divide them by the number of scores.
| x̅ = (46 + 69 + 32 + 60 + 52 + 41) ÷ 6 = 50 |
Step 2: Find each score’s deviation from the mean
Subtract the mean from each score to get the deviations from the mean.
Since x̅ = 50, here we take away 50 from each score.
| 46 | 46 – 50 = -4 |
| 69 | 69 – 50 = 19 |
| 32 | 32 – 50 = -18 |
| 60 | 60 – 50 = 10 |
| 52 | 52 – 50 = 2 |
| 41 | 41 – 50 = -9 |
Step 3: Square each deviation from the mean
Multiply each deviation from the mean by itself. This will result in positive numbers.
| (-4)2 = 4 × 4 = 16 |
| 192 = 19 × 19 = 361 |
| (-18)2 = -18 × -18 = 324 |
| 102 = 10 × 10 = 100 |
| 22 = 2 × 2 = 4 |
| (-9)2 = -9 × -9 = 81 |
Step 4: Find the sum of squares
Add up all of the squared deviations. This is called the sum of squares.
| 16 + 361 + 324 + 100 + 4 + 81 = 886 |
Step 5: Find the variance
Divide the sum of the squares by n – 1 (for a sample) or N (for a population) – this is the variance.
Since we’re working with a sample size of 6, we will use n – 1, where n = 6.
| 886 ÷ (6 – 1) = 886 ÷ 5 = 177.2 |
Step 6: Find the square root of the variance
To find the standard deviation, we take the square root of the variance.
| √177.2 = 13.31 |
From learning that SD = 13.31, we can say that each score deviates from the mean by 13.31 points on average.
Why is standard deviation a useful measure of variability?
Although there are simpler ways to calculate variability, the standard deviation formula weighs unevenly spread out samples more than evenly spread samples. A higher standard deviation tells you that the distribution is not only more spread out, but also more unevenly spread out.
This means it gives you a better idea of your data’s variability than simpler measures, such as the mean absolute deviation (MAD).
The MAD is similar to standard deviation but easier to calculate. First, you express each deviation from the mean in absolute values by converting them into positive numbers (for example, -3 becomes 3). Then, you calculate the mean of these absolute deviations.
Unlike the standard deviation, you don’t have to calculate squares or square roots of numbers for the MAD. However, for that reason, it gives you a less precise measure of variability.
Let’s take two samples with the same central tendency but different amounts of variability. Sample B is more variable than Sample A.
| Sample A | 66, 30, 40, 64 | 50 | 15 | 17.8 |
|---|---|---|---|---|
| Sample B | 51, 21, 79, 49 | 50 | 15 | 23.7 |
For samples with equal average deviations from the mean, the MAD can’t differentiate levels of spread. The standard deviation is more precise: it is higher for the sample with more variability in deviations from the mean.
By squaring the differences from the mean, standard deviation reflects uneven dispersion more accurately. This step weighs extreme deviations more heavily than small deviations.
However, this also makes the standard deviation sensitive to outliers.